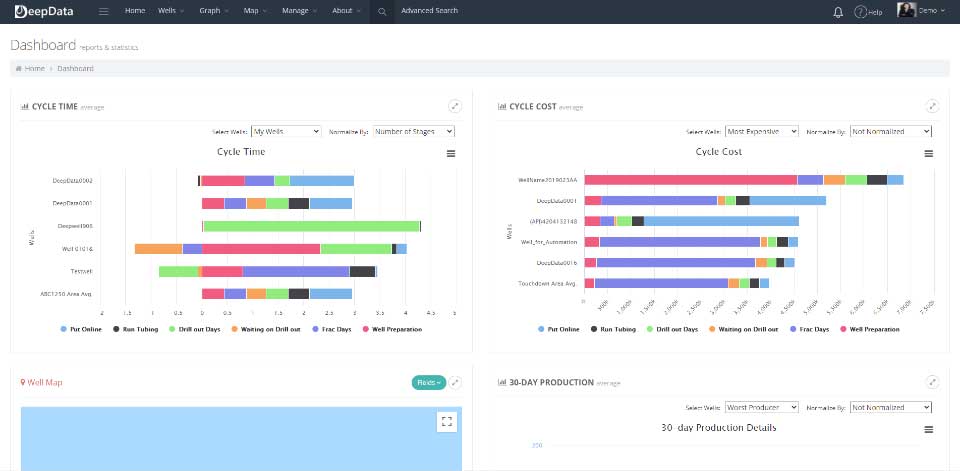
DeepData turns your data into graphs, visualizations, and reports so you can instantly see what is happening on individual wells or pads. Visualizations focus on stages, days, or job level.
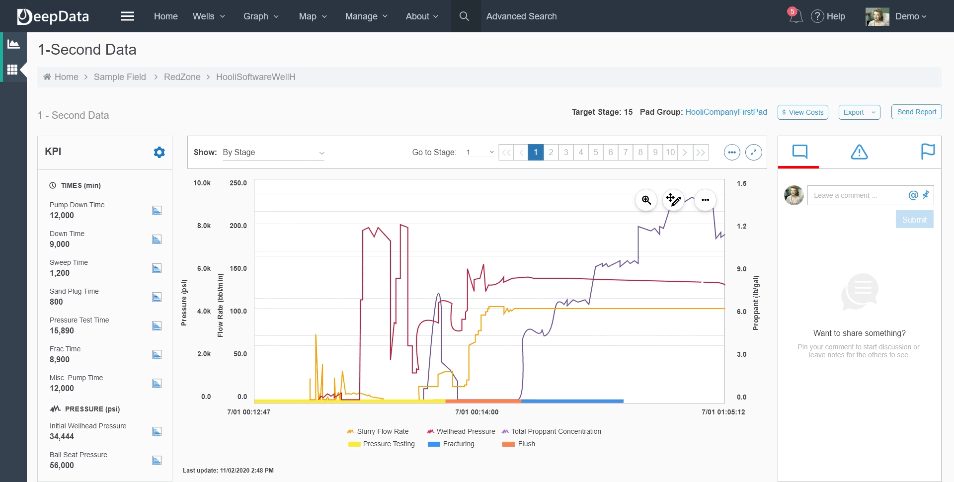

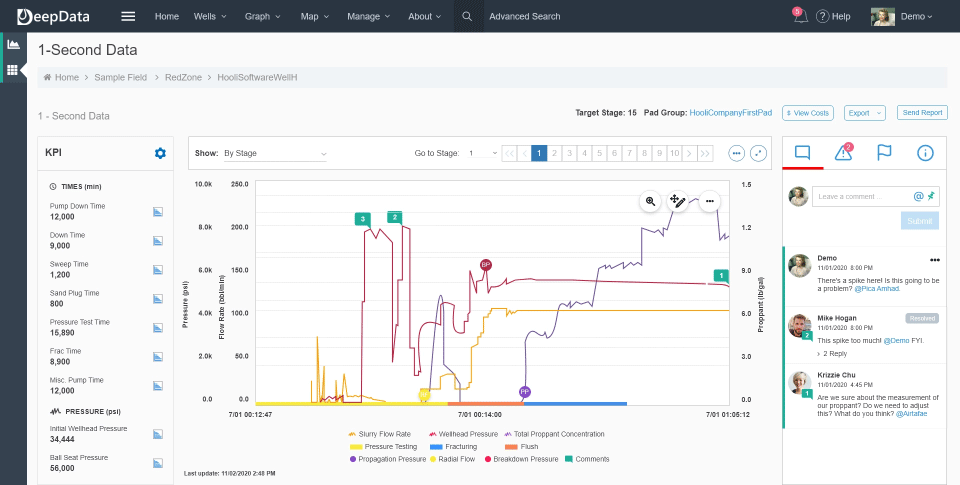
Once you’ve visualized your data, you can drop a pin, tag other users, and discuss the data. If you choose to invite your frac vendor, or other service providers, they can collaborate with you. This is a great way to ask what happened in the field, point out oddities, or discuss anything about your data.

DeepData generates Key Performance Indicators (KPIs) like pump time, average pump rate, and much more. These KPIs are a great way to monitor and compare wells and pads.


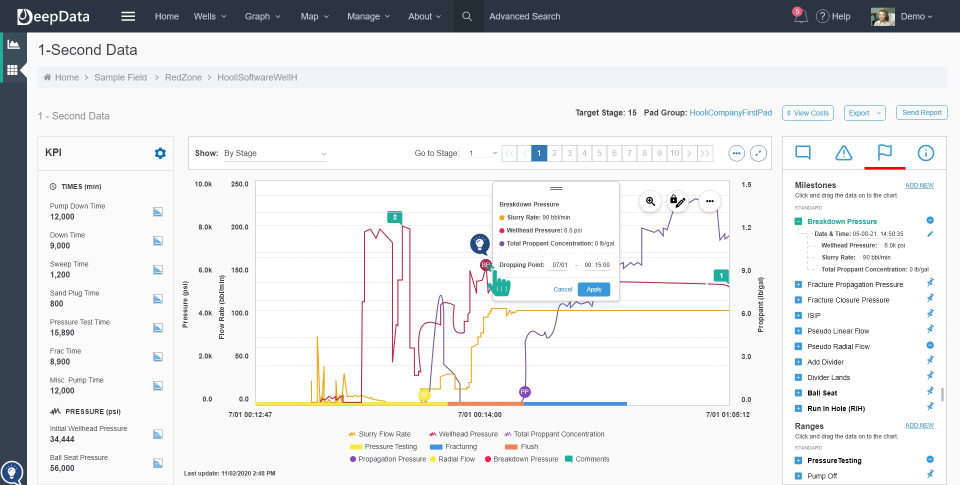
You can define milestones, like breakdown pressure, and ranges, like NPT, by simply dragging-and-dropping pins on your pressure graphs.

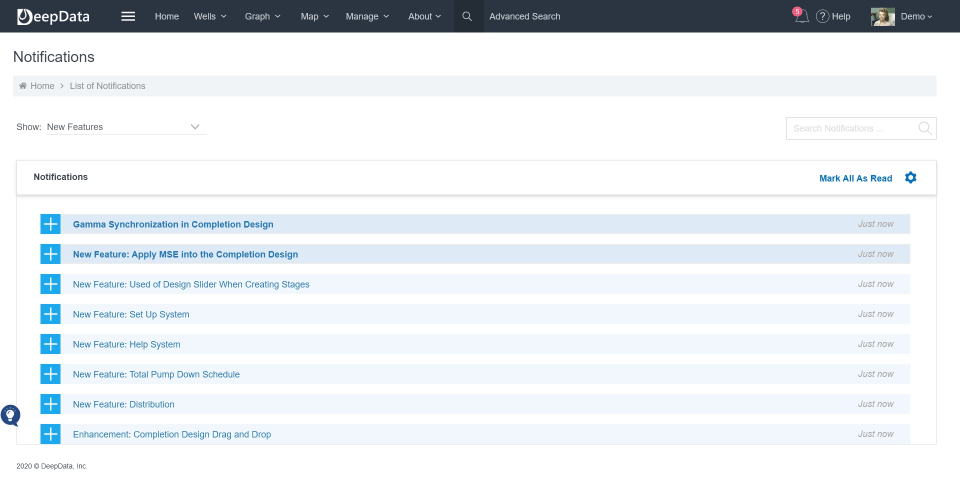
Notifications inform you about a number or things in DeepData, like new activity, new features, etc. This is also how users are informed that they have been tagged in a conversation, so everybody knows when they’ve been tagged.

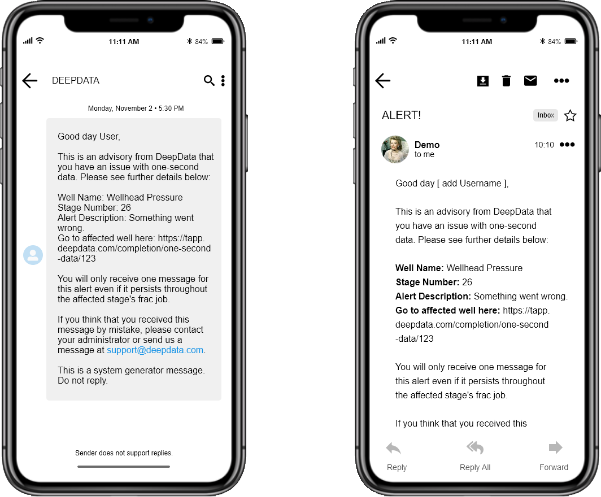
Get email or SMS messages based on your custom alerts. If some measurement is out of range, you get alerted instantly so you can stay on top of things without requiring you to monitor is 24×7.

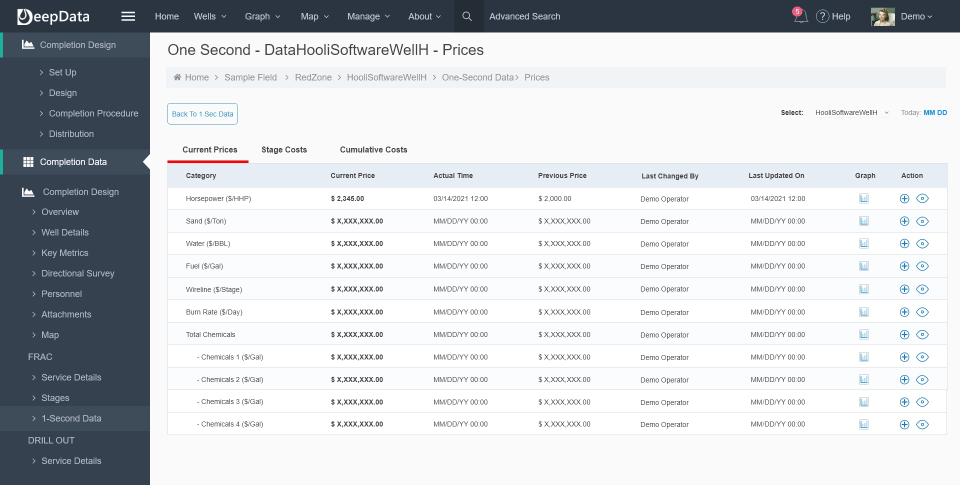
DeepData captures your price history for things like fuel, chemicals, and more. Then it applies this price data to your 1-second data to generate field costs, which it uses mid-frac to estimate the well and pad costs.


Machine learning and data science require good clean data in a normalized (standard) format. DeepData is your source for frac data that is ready and easily consumable by data science tools.

You may want to export your data to a data warehouse, reporting tools, data visualization tools, whatever. This is quick and easy with DeepData.


Your data should always be accessible via the application, export, or APIs. It’s your data to do what you want with it. You can even use DeepData to set-up temporary data rooms.

"*" indicates required fields