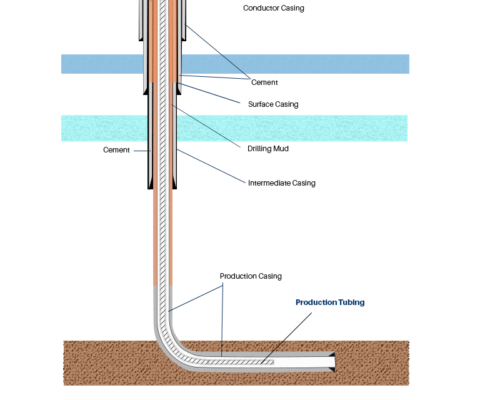
Well completion is a series of processes performed on a drilled and cased oil & gas well, in order to prepare it for production. It involves running production tubing and downhole tools (e.g. mandrels, downhole safety valve, pump, etc.) as required. It also involves perforating and stimulating the well, commonly known as the frac. It can also include acidizing and nitrogen circulation as needed.
While there are many hole types and completion methods, this document will focus on horizontal tight oil & gas (shale) wells that typically use cased hole completion.
In the early phases of oil exploration and production, companies targeted large pools of oil in highly permeable rock. In the lower 48 states of the US and Canada, those pools of oil have been largely tapped. New technologies and techniques now make it possible to cost-effectively extract oil & gas from source rock, shale. When companies were targeting pooled oil, the greatest determinant of success was finding oil. However, in the age of tight oil, the locations of shale are well known. There are certainly significant differences between various shale basins and grades along those basins, where geology plays an important role. However, operations has become increasingly critical to E&P success in the era of shale.
In the shale era, E&Ps drill far more wells per acre. In some ways this is analogous to the automobile’s transition from hand-built to mass production. Just like auto manufacturing, the shift to a well manufacturing model drives massive productivity gains, enabling far more cost-effective extraction of hydrocarbons. Where this analogy fails is that oil wells have far more variability because of the variability of their geology. E&Ps will therefore have very standardized processes, but the formulas will vary from well to well. Think of it as stamping out largely identical wells, but dynamically tuning the completion (e.g. perforation design, etc.) for each well.
In order to achieve a manufacturing process in conjunction with well-specific optimization, we will see an increasing emphasis on well completion. We will see an increased emphasis on capturing and blending well data, operational data and lithology using big data and machine learning tools, to optimize completion on-the-fly. In short, oil well completion will become increasingly important to E&P success.
Well completion is a series of steps–depending upon the completion method–performed after the drilling and casing phase, that enable to well to produce hydrocarbons. The primary goals are to stimulate the well to maximize production, and running tubing to enhance the well’s lifespan and ease of maintenance.
Well completion is a phase of the well lifecycle between drilling and production; essentially preparing a drilled and cased well for production. This document focuses on tight oil & gas wells, since completion is more complex, expensive, and important for these wells.
The well completion process typically involves the following steps:

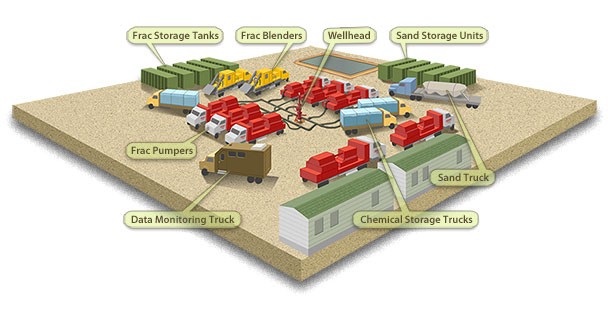
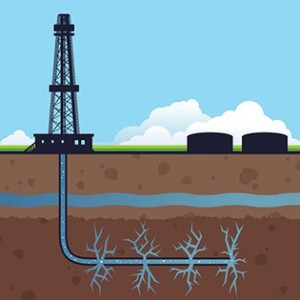
2. Stimulation: Also known as hydraulic fracturing or the frac (industry insiders) or frack (general public). Using methods such as plug and perf, the various stages are isolated so that service providers can perforate and frac the well, one stage at a time. The frac involves pumping down a perforation gun to create holes in the casing to interface with the surrounding rock. Then a combination of fluid (water mixed with surfactants, etc.) and proppant (e.g. sand) are pumped at very high pressure into the well. The water cracks or fractures the surrounding rock. Rock fractures typically extend 250-500 feet from the wellbore, with the longest recorded fracture being less than 600 meters. The proppant included in the frac slurry travels into the fracture and props the fissures open so that oil & gas can flow through them into the wellbore. Stage counts have been increasing lately, with wells often having 100-200 stages now.

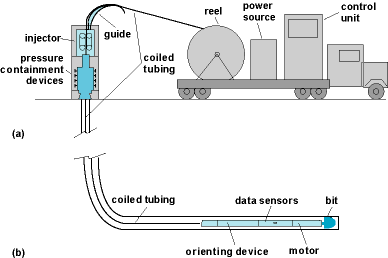
3. Drill-out: This is the removal of any material used to isolate stages during the frac process, often done using a coiled tubing drill-out method. In a plug-and-perf method of stimulation, a service provider drills through the plug that was used to isolate the various stages. Some operators use a dissolvable plug, but at this time, it appears that the drill-out method remains most popular.

(Source: DrillEng Group)

4. Flowback or Put Online: This is the process of bringing the well to production. It may also include shutting in or soaking the well, which some believe increases production and EUR (estimated ultimate recovery), or lifetime production of the well.
Materials Management during the completion process involves the timely purchasing, delivery and storage of all materials required for the completion process, or more specifically for the frac process. Most materials are simply ordered and delivered on time. As a result of longer laterals and growing stage counts, wells are consuming more proppant and fluid (water). Each of these critical materials has their own unique challenges, and with shut down costs of $100,000 – $250,000 per day, you do not want to incur stoppage as a result of a shortage of these critical materials.
Proppant: As stage counts have grown, the amount of proppant, typically sand, has increased as well. Increases in pump pressure, and more perforations per lateral foot, mean more and longer fractures. This increases the amount of proppant required per well. In areas such as the Permian Basin, two factors–high drilling intensity and increased proppant per well–combine to create cost and sourcing challenges for proppants. Not only is sourcing challenging, and expensive, but trucking logistics can also be difficult.
Fluids: Frac fluid requirements are also impacted by increases in the pumping pressures and the number of stages per well. This increases the demand for frac fluid. Unlike sand, which is easily stored onsite, frac fluids have limited onsite storage in frac ponds. These ponds must be continuously replenished from wells, ponds, rivers and lakes. In addition, companies are increasingly treating and reusing the brackish water from producing wells. Frac fluid management–which involves sourcing water, scheduling recycled fluids that cannot be stored in frac ponds, and moving water between ponds as needed, and scheduling the wells that consume the fluids–can be a very tricky process to manage. Of course, with idle costs of $100,000-$250,000 per day during the frac process, running short of frac fluid can be a costly mistake.
Well Completion Engineering encompasses the following steps:
Completion engineers must also stay abreast of the latest developments in technique, materials and technology. This can be accomplished by socializing with services providers who work on other operators wells, data sharing with other operators where the company may have a NonOp position or a data sharing relationship, talking with vendors, attending seminars and conferences, and socializing with other operators over beers. In a rapidly evolving field like completion engineering, where efficiency can mean the difference between making a profit or a loss, staying informed is a critical part of the completion engineer’s job.
Well completion design involves three primary processes: perforation (“perf”) design, pump schedule, and a completion process description. The completion process description and pump schedule tend to vary little from one well to another. However, the perf design varies based on various aspects of each well.
The first step of perforation design is to define the maximum completable length. This takes into account a number of variables, such as hardlines, buffers, production top, trigger toe information, dogleg severity, and more. Once you have the maximum completable length, and its location on the directional survey, you can start to design your perforations.
Perf design then involves a number of variables such as plug offset, cluster spacing, stages, clusters per stage, stage spacing, perfs per cluster, and more. In this phase, engineers may use a standard model. However, the next phase involves fine-tuning that model based on wireline data collected about the well.
The engineer then looks at gamma ray, gas content, lithology and a number of other variables as an overlay to the standard perf plan. Then he fine-tunes various variables to create the perfect perf design for this well.
Once the plan is finalized, he generates a detailed perf plan along with the materials list for perforating the well, such as perf gun requirements.
Well completion reporting is the process of collecting and distributing activity, cost, materials, and operational data from the completion process. Groups such as IADC, PPDM, and Energistics have attempted to establish various standards for coding, modeling, formatting and transmitting certain aspects of this data. Earlier generations of well reporting focused exclusively on delivering a report in paper or PDF format. Second generation solutions add the ability to export completion data to spreadsheets for what-if analysis, creating key metrics and loading into data visualization packages like Spotfire. The newest generation of reporting software leverages a database management system (DBMS) that can produce reports and spreadsheet export, while adding the ability to store far more data, query, filter and manipulate the data, and also enable data sharing between various departments inside the operator, as well as NonOps and data sharing partners. For more insight on this topic, see the Spreadsheet vs. Database article.
During the well completion process, the wellsite manager typically tracks activities and costs in a daily completion report and cost report respectively. This also rolls into a completion summary report. These reports serve a variety of valuable functions as described below:
Completion reporting is one aspect of the completion data flow. It starts with ingesting the drilling data, so that you can tune the completion accordingly. The next aspect is the completion design process, and the data it generates. Then you have the real-time completion data, which may be monitored and/or processed in real-time. Then comes the reporting process and the data it generates. After this comes the data sharing with NonOps and data sharing partners. Finally you have the post job data analysis, where you generate key metrics, comparisons, data visualization and more, enabling you to assess the efficiency of the processes and methods, which is used to optimize future wells. Then the data is handed to the production team, so that they can optimize maintenance and production of the well. As you can see, the completion report isn’t merely a document, but merely one phase of the flow of data.
Well completion optimization is the analysis of completion data, in order to improve well productivity, while reducing well costs. As stated above, the key to E&P profitability in tight oil & gas wells is operational efficiency, doing more for less. While some E&P companies look for the fixed cookbook for a particular geology, area or basin, the most effective operators are constantly pouring over internal and external data in order to discover new and better methods.
At a typical cost of $6M-$9M per onshore horizontal well, most companies are unwilling to test significant changes to their processes, they instead prefer to employ stepwise improvements. At the same time they learn from others what has worked in similar geologies. The combination of various stepwise advances has resulted in very impressive cumulative advances in efficiency.
Well completion optimization is a data driven process that requires the following:
Data Quality: The old adage garbage-in, garbage-out applies here. If your data is incorrect, your results will be incorrect. Software tools, internal processes and solid data quality control are required to ensure that you start with high-quality data.
Data Depth: This essentially refers to how much data you collect. You will want to blend operational data (e.g. pressures), with materials data (proppant types and amounts), activity data (processes used on the well), production results, cost information, directional survey data, and various key metrics derived from this data. All of this can be used in what-if scenarios, data visualization and dashboarding, and machine learning to fuel optimization.
Data Breadth & Variability: Data breadth refers to having large numbers of wells in your system. The more wells you have, the more statistically relevant the results. You also need variability between wells. If every well is the exact same, you can have 1,000 wells in the system and learn nothing. However, a high degree of variability between wells enables you to learn what factors improve well results. This is analogous to the favorable adaptation in evolution. If nothing changes, there is no way to learn how changes can affect results, so there is no optimization.
Data variability, or diversity, is critical to fuel well completion optimization. However, this data must also be high-quality and have sufficient depth. Public data can help with breadth–including many wells–but is woefully inadequate in terms of data depth. Public data can also suffer from intentional obfuscation by operators in their reporting. For example wells might have multiple laterals, sidetracks, etc. and yet that is not identified in the data. This can result in erroneous insights. Erroneous results are more problematic than no results at all, since they send you in the wrong direction. We believe that the only solution sourcing data that offers quality, depth, and breadth & variability is through data sharing relationships.
Well data is generally shared for the following purposes:
As an operator, inbound data sharing is an excellent way to get data that is high-quality, broad, and deep. When the key driver of the E&P business was finding oil and gas, companies viewed well data as a company secret, never to be shared with competition. They wanted to buy up all of the surrounding land cheaply and over time, as their capital grew. If word got out about a major find, their competition would buy up the land around them. Today, the key driver of E&P success is operational efficiency. Most of the mineral rights have been acquired around known shale basins, so competition for mineral rights is less of an issue. While some companies still jealously guard their procedures, most realize that the community–employees at operators, and service companies and their employees–provide a communication channel that shares best practices. Even if a service provider adheres to a non-disclosure agreement, an operator can say, frac this well like you did that one for my neighbor.
With the cat already being out of the bag on best practices, most operators recognize that data sharing is an excellent way of accumulating superior data for evaluation and optimization. We suspect that data sharing will become standard procedure among operators.
One of the barriers to more extensive data sharing is the tower of Babel issue. Most completion data is stored in spreadsheets, with each company, and sometimes each engineer, employing their own spreadsheet structure. It typically requires completely retyping the data from a sharing partner into your format, in order to make it usable. However, spreadsheets are sub-optimal tools for searching, selecting a groups of wells based on certain criteria, and then processing those wells using various optimization tools. The most effective data store for optimization is a database.
There are a number of software solutions that focus on well completion data. The service providers have software specific to their function (e.g. FracFocus). There are various tools for handling SCADA data from smart devices. Activities and cost reporting tools are available. There are real-time tools for handling the real-time or per second data. But the primary tools used for well completion optimization are Excel or a database for data storage and manipulation, various data visualization tools (e.g. Spotfire), and various machine learning tools (machine learning is still early in oil & gas).
While you can read an in-depth analysis of the relative merits of the spreadsheet and database, here is a quick synopsis of the relative merits:
Pros:Ideal for quick and simple data entry and calculations (e.g. key metrics). Provides a good visual mechanism for comparing one attribute across multiple wells by simply scanning a row/column or generating a simple chart.
Cons: Inefficient as data depth increases, because the user is forced to scroll far too much. Maintaining 1:N and N:N relationships (e.g. 1 well:100 stages) is difficult and makes the spreadsheet hard to maintain. Terrible at selecting wells based on various criteria, filtering wells, getting to a working set of wells. Not designed for data sharing and access rights control.
Pros: Ideal for massive depth and breadth of data. Designed for iterative well selection, based on any number of criteria, filtering and processing across big data. Designed for managing rich relationships (1:1, 1:N, N:N) and providing granular access control, which is required for data sharing. The database can also output spreadsheets, making it an ideal data storage and processing tool.
Cons: Requires more technical expertise to design and build, but applications built on databases tend to be more user-friendly than spreadsheets. The typical user can quickly add a new formula in a spreadsheet, but requires help to work with a database.
Drilling is a fairly mature process. While drilling continues to benefit from advancements in technologies and methods, the area where we see the most rapid advancements and the biggest opportunity for optimization is in the completion phase. Since it is advancing most rapidly, it is the phase where optimization can deliver the biggest gains in efficiency at this time.
We envision a day when extensive wireline data will inform completion design, with more variation from stage to stage. In effect a completion design that is optimized for the specific characteristics of each well. We agree with Mark Mills, that continued advances will enable shale wells to rival the economics of conventional wells over time. We also believe that advances in technology will make more shale basins economical to drill at low oil and gas prices. In short, we see a bright future that benefits from riding the technology curve toward cheaper and more efficient solutions.
"*" indicates required fields